Total Fleet Performance – Increased Utilization

Compressor performance is tracked within Detechtion Technologies’ Enalysis™ system every time a compressor’s operating data is entered to generate an Enalysis™ performance report. Clients, therefore, have the ability to track and report compressor fleet performance and various other parameters via Fleet Management Reports and Tools within Enalysis™ and by taking timely action to optimize their compressors on an ongoing basis this can have a significant impact to their overall bottom line by not missing opportunities.
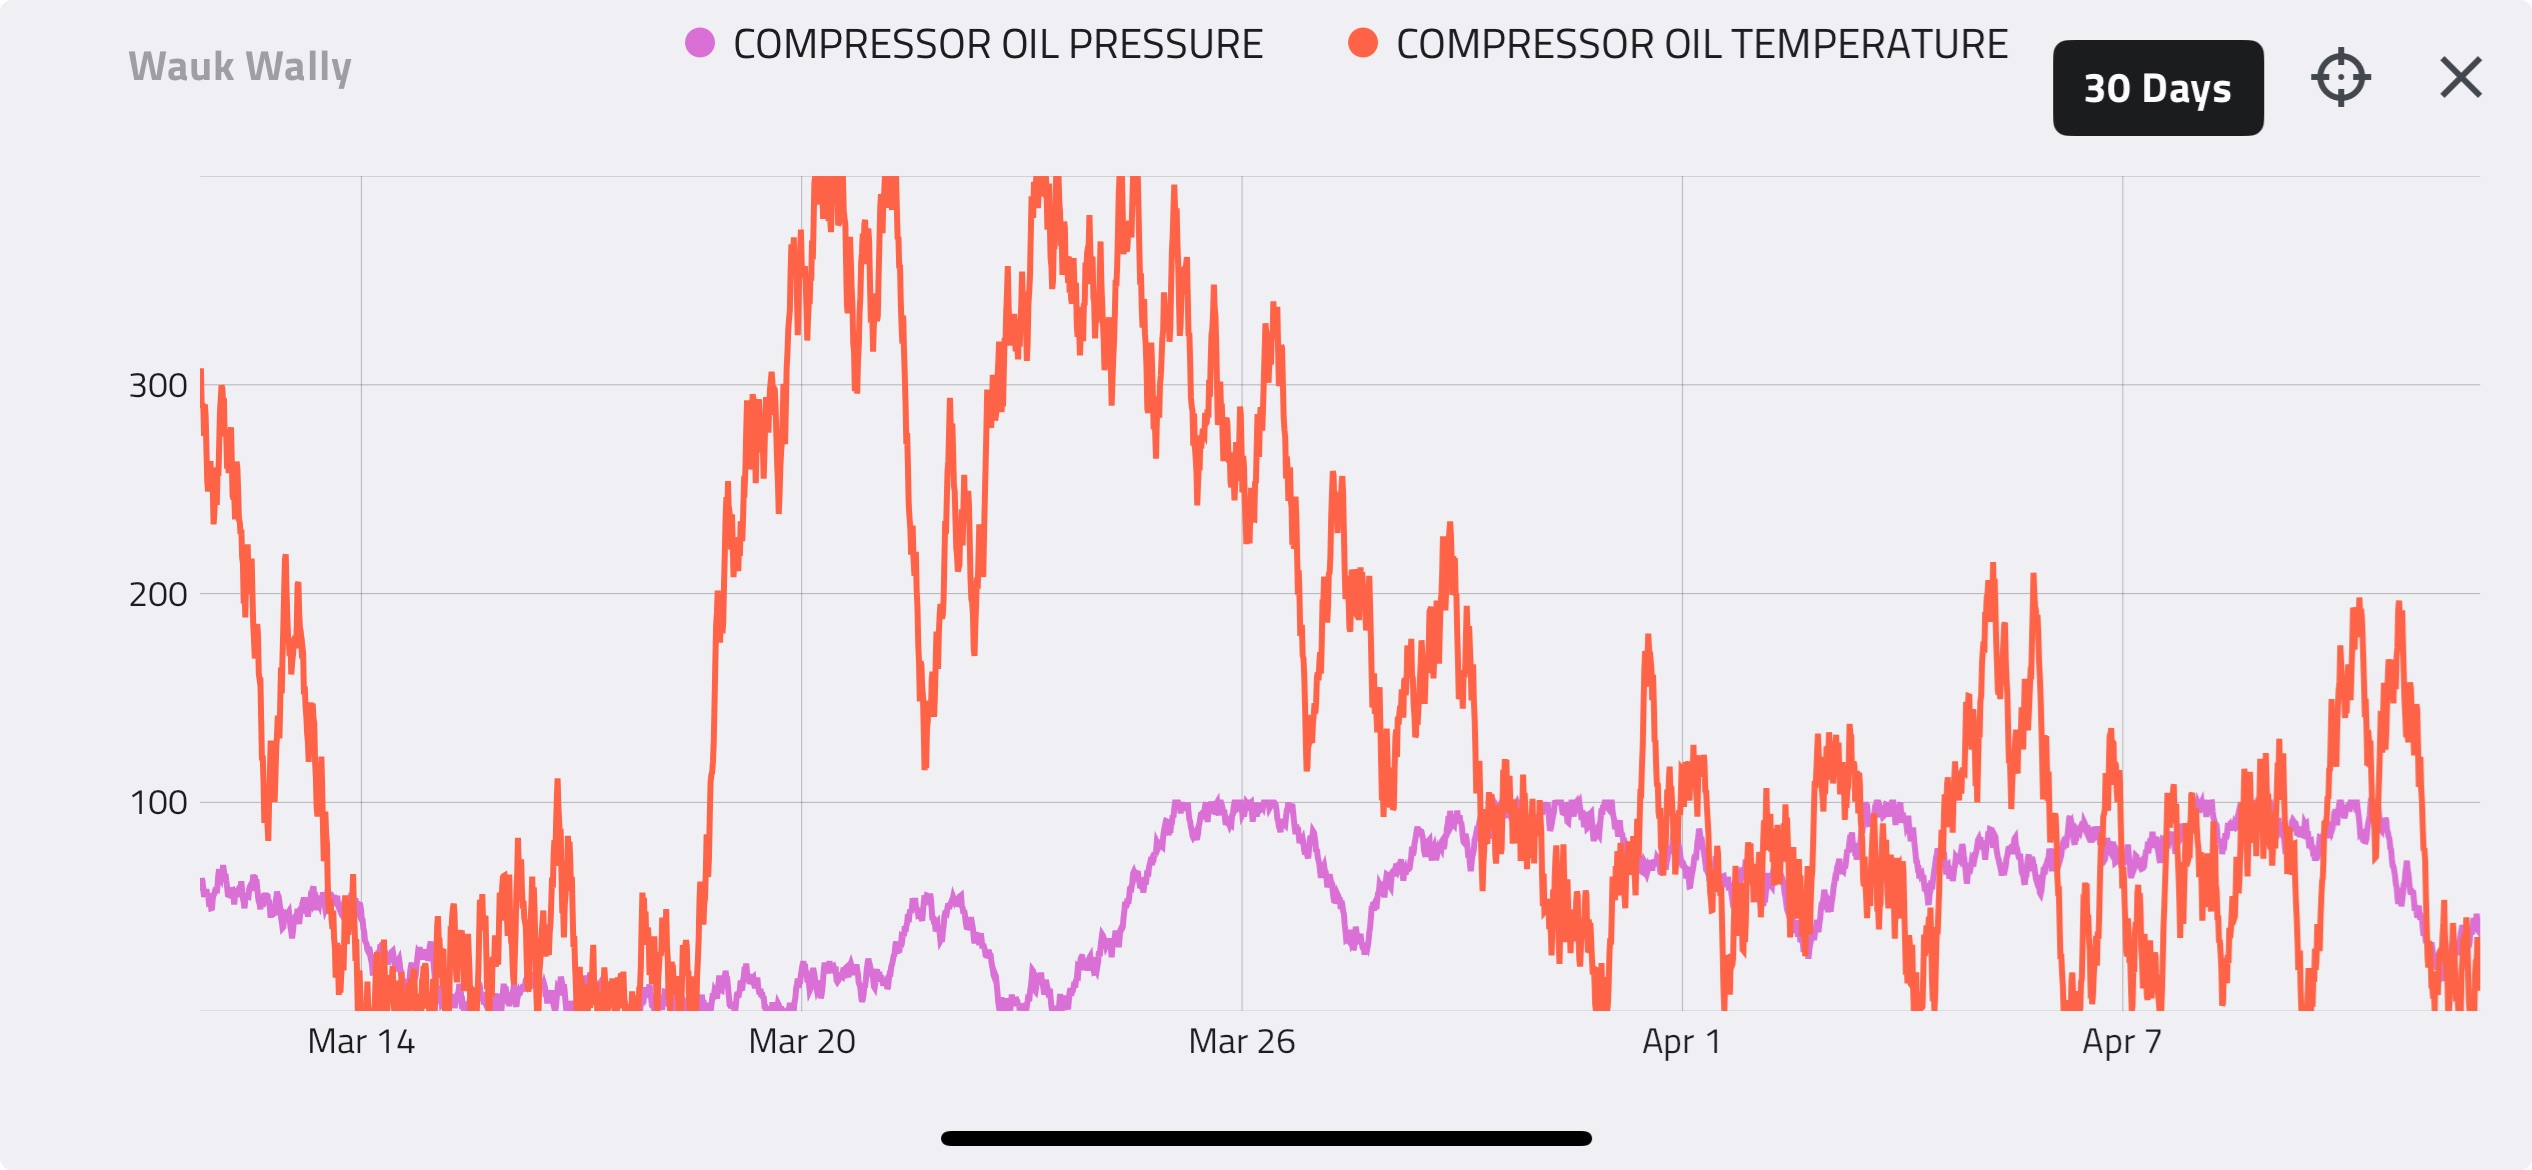
The Performance Graph in Enalysis™ graphs the average performance (compressor flow divided by the total potential flow) of the compressor in a certain region over a period of time. This graph is, therefore, a direct indication of the utilization of the compressor, as determined by the greater of the power utilization and the cylinder capacity utilization, and allows the client to identify the regions where production is not optimized.
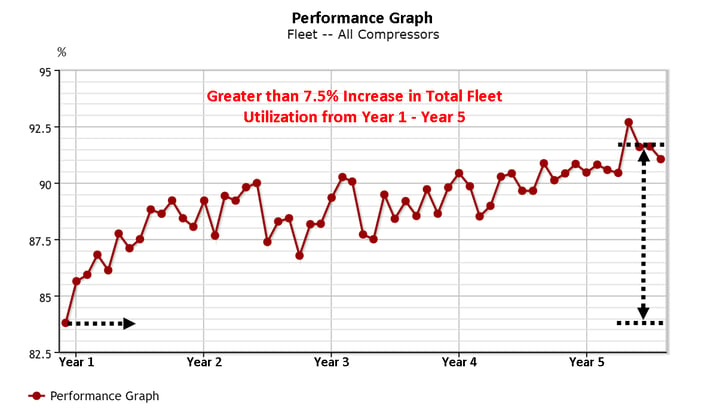
The graph shown below represents the performance for the entire compressor fleet of a long term Detechtion client over a period of 5 years. The graph shows a continuous improvement in compressor fleet performance over the last four years and a total, fleet-wide performance improvement of more than 7.5%.
What is the value of 7.5% increase in total fleet performance?
In the case of this client, with a compressor fleet of well over 100 operating units and more than 200,000HP, 7.5% could represent 15,000HP of power used more effectively.
Alternatively, with a reported daily throughput of more than 1,000mmscfd, 7.5% could represent 75mmscfd of increased potential production.
Input your average daily gas price ($/mscfd) to see what this could be worth to your company:
Gas price: $
Throughput: mmscfd
Result: $54,750,000.00/Year
Background:
Maximizing the throughput of a compressor simply means maximizing the capacity of the compressor. In a competitive natural gas gathering application, maintaining the lowest suction pressure can provide a significant production advantage to any gas producer.
To maximize the throughput of a reciprocating compressor there are two concepts in play. The first concept being, the gas has to go through the first stage of a compressor to go through the rest of the unit; hence the importance of maximizing the capacity of the first stage cylinder(s). The capacity can be impacted by clearance devices such as Variable Volume Clearance Pockets (VVCP) or Fixed Volume Clearance Pockets (FVCP) that add clearance to the head end of a cylinder. Clearance can be added to the crank end of a cylinder by adding valve spacers under the valves. The running speed of the compressor and single acting the crank end or head end of a cylinder will also influence the capacity of the machine. The second concept is to increase the capacity of a compressor by increasing the suction pressure; which means that the suction pressure is dictated by the flow of the compressor or vice versa.
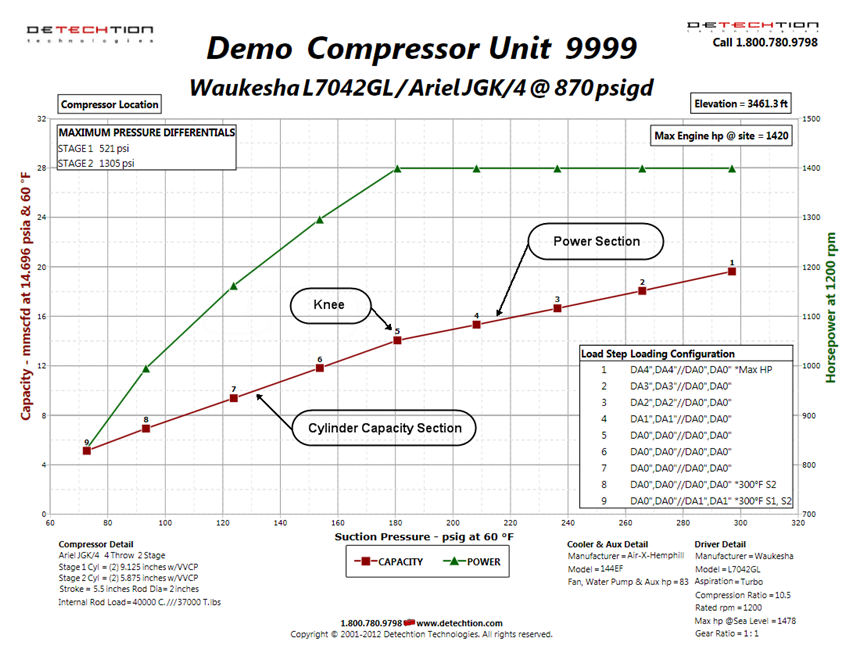
The loading curve shown in the figure below shows the optimized performance of a two stage unit at a discharge pressure of 870 psig. The curve can be divided into three segments: the cylinder capacity, the knee and the power section.
- The cylinder capacity portion of the curve implies a cylinder capacity utilization of 100%, which means no clearance is added to the first stage cylinder(s) and the driver is running at maximum speed. This can be translated on to having the first stage cylinders double acted with no spacers, the VVCP or FVP fully closed and the driver speed set to the maximum.
- The power section of the curve indicates a horsepower utilization of 100%. In this portion of the curve, clearance devices are generally used to unload the driver and this is translated as an increased capacity while maintaining the horsepower usage to the maximum.
- The knee of the curve is the only point on an optimized loading curve where the cylinder capacity utilization and horsepower used is at 100%.
For a reciprocating compressor to be fully optimized for maximum throughput, either or both the cylinder capacity utilization and the horsepower utilization should be at 100%.
Through the use of individual compressor performance curves, such as the one above, and a Detechtion Technologies Start-up Package of high and low pressure trip-points, shown below, compressor units can be evaluated for opportunities to:
- Increase running speed
- Reduce added cylinder clearance
- Optimize suction pressure
- Decrease recycle set point
Thus resulting in increased utilisation and maximising throughput.