In natural gas gathering applications, maintaining the lowest possible suction pressure can provide a significant production advantage. As fields fluctuate and, over time, decline, compressor optimization must be done on a regular basis in order to minimize suction pressure, while maximizing throughput and maintain high levels of overall fleet utilization.
Compressor performance curves are a graphical representation of the optimized suction pressure operating range of a compressor given assumed conditions. The flow presented on the curve is the highest throughput that is possible at the specified suction pressure and the power is the total required power consumption for the compression to take place.
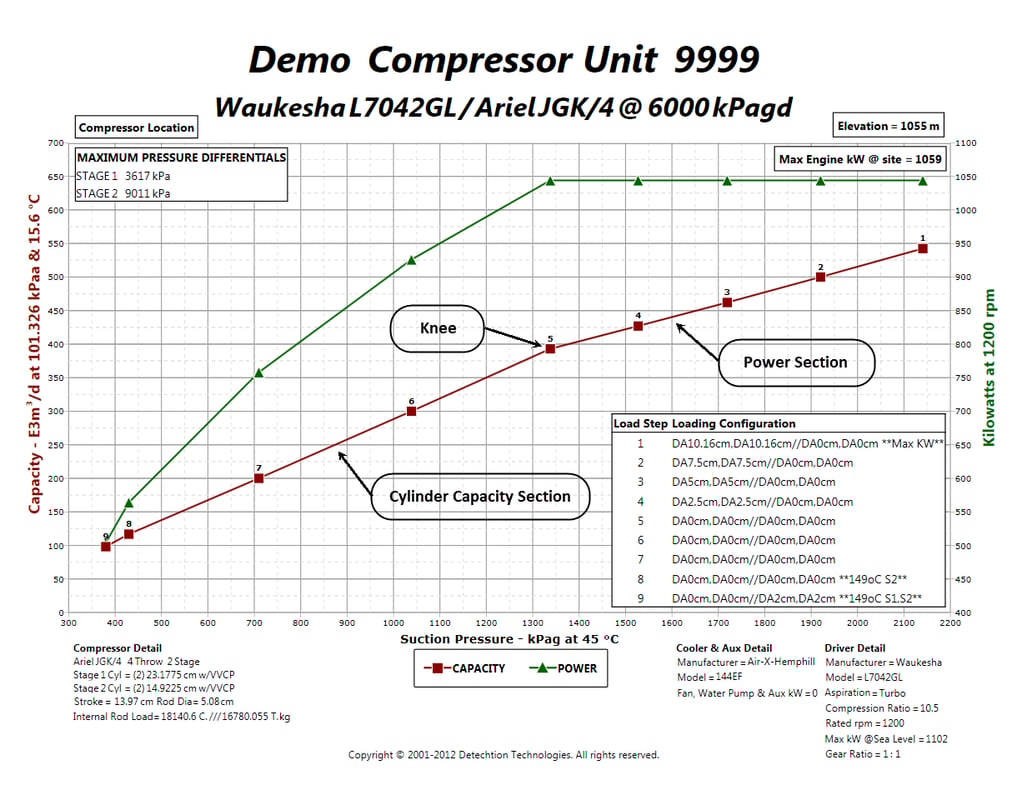
Reciprocating Compressor Performance Curve
The loading curve shown in the figure below shows the optimized performance of a two-stage unit at a discharge pressure of 6000 kPag. The curve can be divided in three segments: the power section, the knee and the cylinder capacity section.
The power section of the curve indicates a power utilization of 100%. In this portion of the curve, clearance devices are generally used to unload the driver and this is translated as an increased capacity
The cylinder capacity portion of the curve implies a cylinder capacity utilization of 100%, which means no clearance is added to the first stage cylinder(s) and the driver is running at maximum speed.
The knee of the curve is the only point on an optimized loading curve where the cylinder capacity utilization and power used are both at 100%.
 A COMPRESSOR PERFORMANCE CURVE
Reciprocating compressors can only be fully optimized for maximum throughput if either the cylinder capacity utilization or the power utilization, or both, is 100%.
Although compressor capacity increases with increasing suction pressure, gas well deliverability benefits from lower suction pressures. The ability of a well to flow gas increases with a decrease in flowing bottom-hole pressure, which can be directly influenced by compressor suction pressure. This relationship is represented by an Inflow Performance Relationship (IPR) curve.
An IPR curve can be done for an individual well or an entire field and represents the relationship of the well or field deliverability to changes in the flowing bottom-hole pressure. A typical well IPR Curve is shown in the figure below, where the maximum deliverability is equivalent to the absolute open flow (AOF). The AOF is the rate at which the well would produce if there were no back pressure and is a measure of well performance and deliverability. Notice how decreasing pressure, P (y-axis), results in an increase in production, Q (x-axis). What this tells us is that an increase in compressor suction pressure will result in a decrease in well deliverability and a loss of production while a decrease in compressor suction will stimulate the well deliverability and potentially increase production.
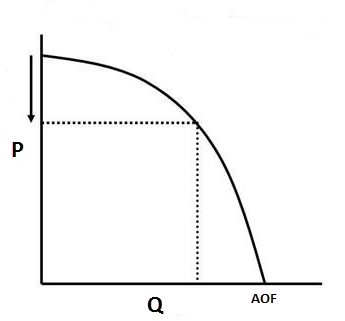
WELL DELIVERABILITY RELATIONSHIP
The shape of the IPR curve will vary for each well depending on reservoir characteristics. As well, the IPR curve of a well will tend to shrink with continued gas production due to the resulting decrease in reservoir pressure.
Reversing the x- and y-axis of an IPR curve allows us to plot the well-deliverability relationship on a compressor performance curve. Continually optimizing a reciprocating compressor so that either the cylinder utilization or power utilization remains at 100% ensures operation at the point of intersection of the IPR curve with the compressor performance curve. As the compressor performance curve represents the maximum possible throughput of a compressor at any given suction pressure and a fixed discharge pressure, the intersection point of the IPR curve with the compressor performance curve is the optimum operating point with the current compression equipment. Any increase in suction pressure would result in a decrease in flow to the right side on the IPR curve. Alternatively, any decrease in suction pressure can only be obtained through additional compression capacity, obtained either by adding more compressors or by substantially modifying the current installed compressor package.
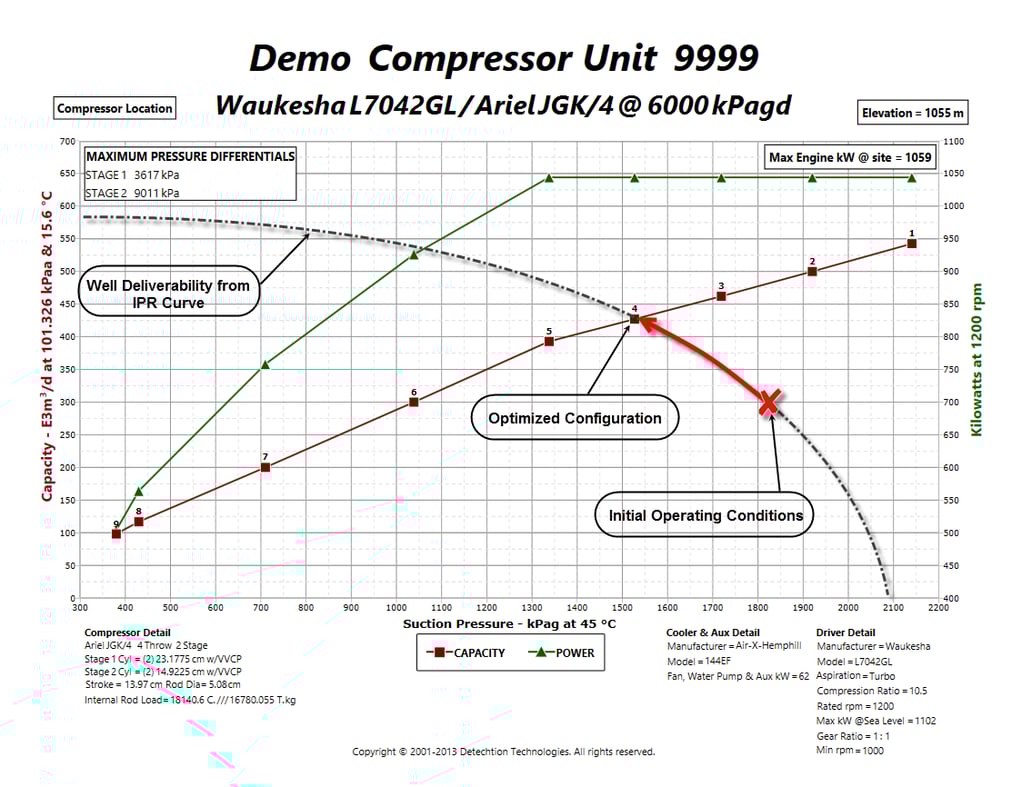 COMPRESSOR PERFORMANCE CURVE WITH EXAMPLE IPR CURVE
In the performance curves above, the optimized compressor performance curve is represented by the red flow line through points 1-2-3-4-5-6-7-8-9. While the VVCPs remained closed between points 5-6-7-8, points 1-2-3-4 and 9 were obtained by adding a set amount of clearance to the cylinders through precise pocket positions.
At any point in time, a compressor has a performance curve specific to the current configuration. This is illustrated by the dotted lines extending from points 1, 2, 3 and 4 in the performance curve in the figure below. However, reciprocating compressors can only be fully optimized for maximum throughput if either the cylinder capacity utilization or the power utilization, or both, is 100%. Therefore, the dotted lines represent operation that is not fully optimized. For compressor performance to remain on the optimized performance curve, adjustment of the pockets will likely be required.
The operating suction pressure and flow of a fully optimized reciprocating compressor is the intersect of the optimized compressor performance curve and the field deliverability curve.
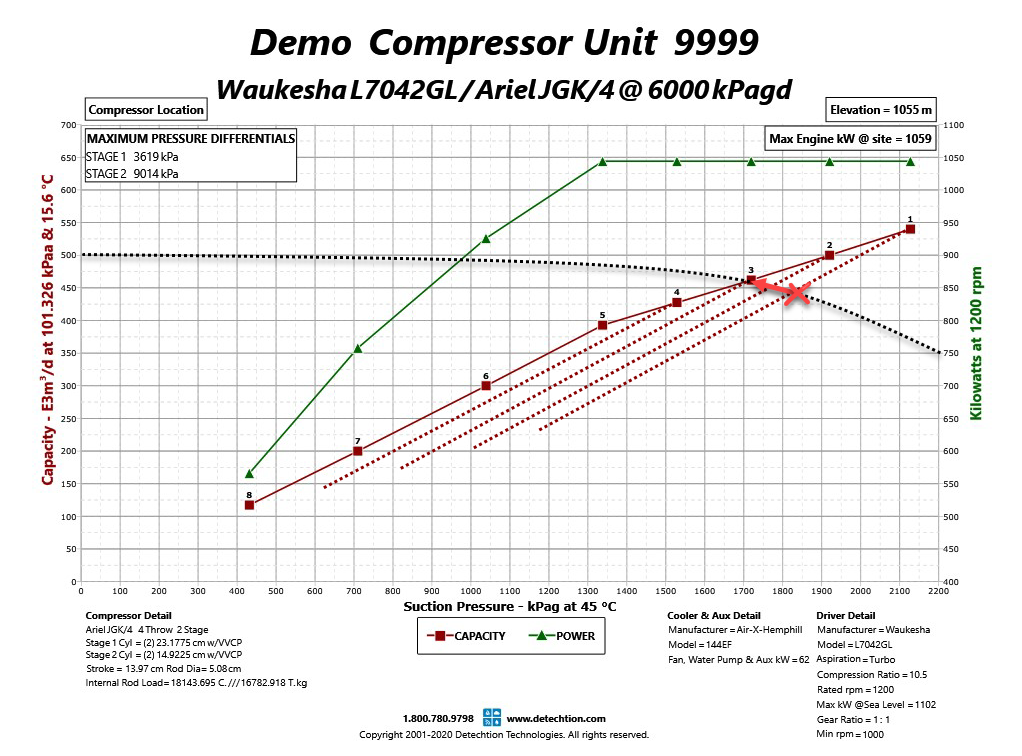
PERFORMANCE CURVES FOR SELECT VVCP POSITIONS
Did you know that you can use the Enalysis Simulation Tool to model the operating range of any compressor enrolled in Enalysis? Click to read E-Tip 1.14 Compressor Performance Modelling with Enalysis Simulate now.