January, 2013
Calgary
The below summary highlights a tremendous improvement in performance experienced by one of our clients at a Five Compressor Station after some configuration changes were recommended and implemented on January 16th, 2013:
BACKGROUND:
- The station consists of five compressors, Ariel KBZ four throw – three stage units driven by Caterpillar G3616 engines. Each is equipped with ACI automatic un-loaders (Fixed Volume Pockets and valve un-loaders), speed controllers, and suction pressure controllers.
- They can be operated in any configuration of 10 separate load steps. Load Steps 1 through 6 involve double-acting cylinders and load steps 7 through 10 involve single-acting cylinders.
- The compressors commenced feeding data into Enalysis on November 23, 2012
IDENTIFIED ISSUES:
- The main issue with these compressors was they were operating in completely different load steps even though they were running under the same field conditions. The suction and discharge pressures were swinging often, causing the compressors to fluctuate between load steps (up to 4 or 5 times or more in a day).
- This discrepancy across the compressors was causing the station to run under largely varying suction pressures. This scenario is not ideal for the compressors or for the wells supplying gas.
- At the time of audit, the compressors were not able to move more gas even if the suction pressure set-point was increased.
- Additionally, several blowby flags were identified on preliminary Enalysis reports. One of these blowby conditions was causing its compressor to run into a rod load situation of 96% of maximum allowable rod load.
ACTION TAKEN:
- The first step was to address the “easy” fixes by pointing out blowby (valve issues). These were remedied very quickly by the compressor maintenance teams. The results of these fixes can be seen below:


Unit #1:
Unit #2:
After measuring the result of the fixes involving the two compressors with blowby issues, they were moving approximately 4 mmscfd more(combined) and rod load issue disappeared! - Other than the blowby issue, the compressors were relatively sound from a mechanical standpoint so the next step was to build Optimized Loading Curves for all five of the compressors. See one of them below:

It can be seen that beyond 150 psig, which is when Load Steps 8, 9 and 10 are initiated, the compressors will not move more gas. Even at 200 psig at Load Step 10, each compressor will move about the same amount of gas (approximately 30-31 mmscfd) as it does at 150 psig with a tighter load step (such as Load Step 6).
This finding plus the fact that the compressors were constantly swinging between load steps prompted the Detechtion engineer to recommend setting the suction controller at 150 psig (down from 165 psig). - The third step was to utilize the Detechtion loading curves to reconfigure the compressors for more efficient operation. One positive aspect of the Detechtion curve, is that it shows the actual range of operation of these compressors (which is from 41 psig – 200 psig of suction pressure) at 1250 psig of discharge pressure. By utilizing the information provided by the loading curve, the client was able to widen the suction controller set-points from a range of 120-165 psig to a range of 70-150 psig. The benefit of this discovery and subsequent action is that the compressors, which were way too unloaded to meet that tight suction pressure setting, would have a much broader range in which to operate.
- The fourth step in the transformation of this compressor station was to make final adjustments. The information provided by the Detechtion loading curve also allowed for an adjustment of the compressor pressure alarms and shut-down kill switches. The alarms and kills were tuned according to the new suction pressure range, as per the table below:


RESULTS:
- The results were immediate. The compressors stopped swinging between load steps because the new range of suction pressures allowed them to run at a lower pressure. Each compressor finally stabilized at approximately 105 psig.
- The compressors were all synchronized at similar load steps; as was expected.
- The flow dramatically increased and remained steady, which is beneficial for both the operation of the compressors and of the wells.
This is a snapshot of two points in time (before and after the changes) for the station. It clearly portrays the significant improvement of the station as a whole: 
Before the changes, some of the compressors tended to fluctuate between heavily loaded and heavily unloaded because the ACI controller was trying to meet the limited suction pressure range (120-160 psig), and the station was moving a total of 100.5 mmscfd at 126 psig. After the changes the station increased in overall flow to 133.4 mmscfd at 106 psig of suction pressure.
This equates to a 33 mmscfd improvement in less than 48 hours. When the price of natural gas is taken into consideration, the overall improvement in flow equates to a monthly increase in revenue of approximately 3 million dollars!
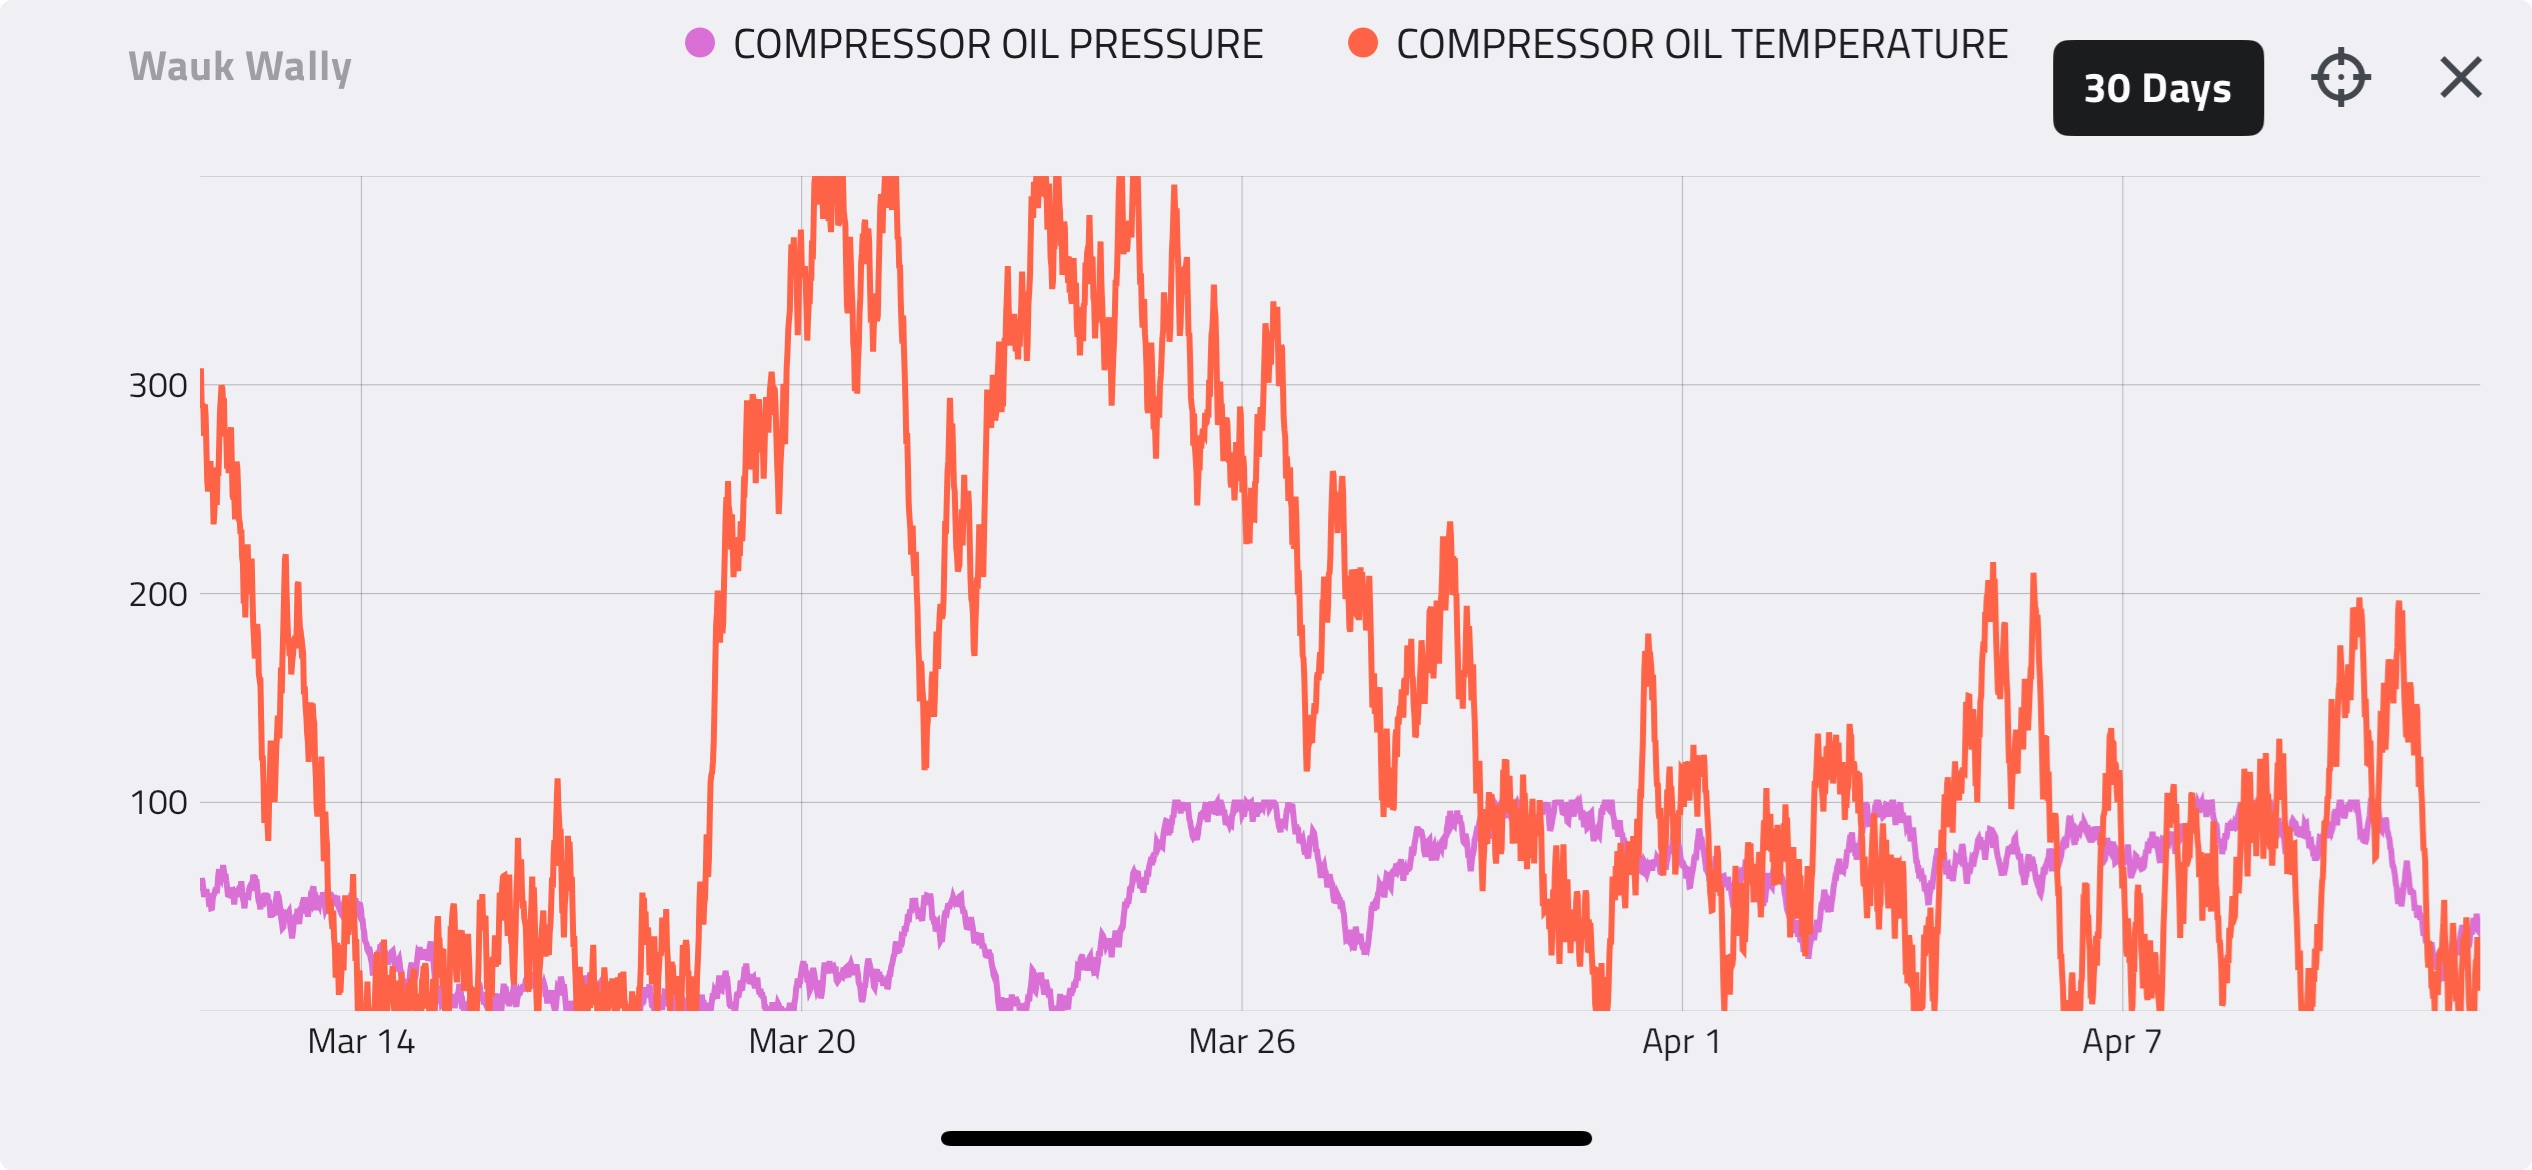
This can also be seen on the client’s automated flow trend for the entire station:

Before the changes in configuration, the swings in operation are evident. The arrows on the graph point to large swings in flow – caused primarily by the issues with the station / compressor settings. Similarly, after changes in configuration were made, the operation of the compressors and the station flow rate improved. Also, the previous detrimental fluctuations were significantly reduced.
Finally, below, the flow for the individual compressor #5 can be seen. It clearly shows the wild flow swings before the configuration changes (highlighted by the arrows), stopped on Jan 16th.

SUMMARY
Three key items were instrumental in achieving this level of success for our client:
- The comprehensive nature and precise utilization of the Enalysis system
- The work and attention by the Detechtion Engineering Account Manager to uncover the opportunity
- The collaboration of the client and our staff, working together to achieve the same goal
The measurable result is in the range of $100,000 per day of increased production. This is in addition to intangible improvements such as unforeseeable avoidance’s in compressor downtime, and a higher level of cognizance by the compressor operations team.
CLIENT FEEDBACK
“…I see the results you accomplished with the configuration changes on the compressors. I can’t tell you how valuable you and Detechtion have been to our operations. I look forward to your assistance in the future especially at [this station]. There is a lot of learning with these units that our guys need to develop, and [they] have pretty much relied on [the leasing company] to help with proper loading sequences. Obviously this has not worked out too well. Now that you have been working with the guys (mainly Josh), the results have been dramatic… Once again, THANK YOU, for all your efforts.”