Tech Tip
The Optimization Life-Cycle
Compressor optimization is an ongoing process aiming to maximize production revenues while minimizing operating costs, all the while holding safety paramount. The engineering approach and delivery to achieve compressor optimization will vary on a case-by-case basis, while the workflow process often remains the same:
- Identify Opportunity
- Define Optimization Objectives
- Create Solution – Start-up Package
- Track Results
The steps above highlight the basic framework needed to assess an optimization opportunity. Often times, there are restrictions set by existing business processes, upstream/downstream conditions, parallel/series compression, or facility limits which must also considered but are not detailed in this article. It is important to consider the impact of any process change, in order to anticipate the expected benefit and risk as part of any management of change (MOC) process. With proper planning and execution, compressor optimization often results in a high value return for low cost efforts!
- Identify Opportunity
Finding an opportunity is the first step in optimizing a compressor. Whether you are regularly assessing Enalysis™ reports or closely monitoring its operation, here are some questions you can ask yourself to see if an opportunity presents itself:
- Is your compressor not meeting the defined objectives it was set out to do?
- Is your compressor bypassing or pinching back the suction control valve often?
- Is your compressor frequently hitting alarm set points?
- Does your Enalysis™ report frequently indicate CFRs or other flags?
If the answer to any of these questions is yes, then you might have an opportunity to improve production or reduce your operating costs!
- Define Optimization Objectives
Defining the ideal outcome beforehand can determine the success of the opportunity early on. Accommodating additional production, allowing for increased line pressure, or improving on the current operation are all common scenarios that can typically be defined with some accuracy. By considering a range of operating conditions, we can setup a compressor more capable of handling a multitude of conditions.
When given a range of potential operating conditions, Detechtion will often focus on accommodating a wider array of conditions, instead of running at a fixed point. The reason being is that compressors are often subjected to variable conditions, and any time a compressor pinches back gas with the suction control valve or recycles to regulate pressures, efficiency is lost.
- Create Solution – Start-up Package
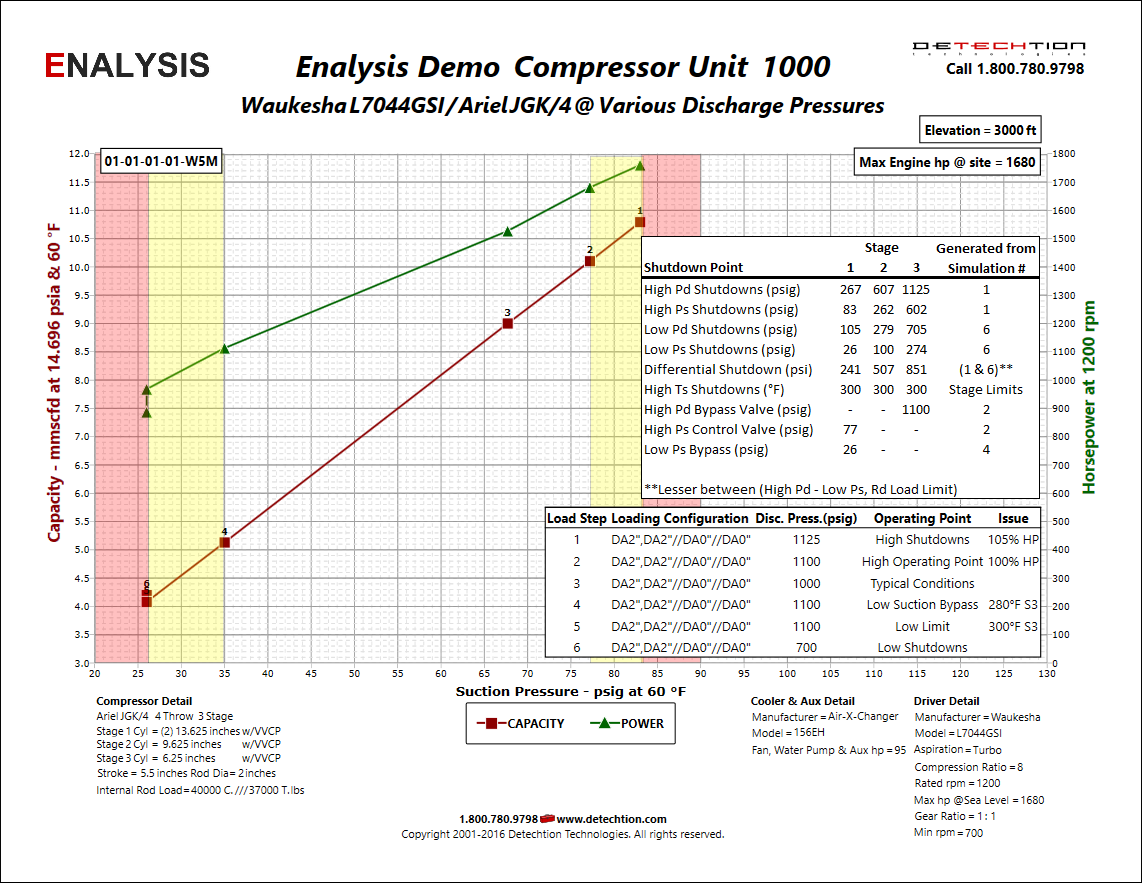
Using Detechtion’s Curves, Online Simulator, or reaching out to your Engineering Account Manager will enable you to find the optimal solution for your compressor. Assuming we have a 3-stage compressor, and are setting up the compressor to handle the 8 to 10 mmscfd at a discharge pressure range of 700 to 1100psig, Enalysis™' Simulator determined the ideal configuration to be DA2”, DA2"//DA0"//DA0" with the limiting factor being 99% HP Utilization. Upon finding the ideal configuration, we need to verify the compressor can handle the other operating conditions, and make sure we are going to be satisfied with the outcome.
| Variable | Min | Average | Max |
|---|---|---|---|
| Configuration | DA2",DA2"//DA0"//DA0" | ||
| Discharge Range (psig) | 700 | 1000 | 1100 |
| Flow Range (mmscfd) | 8 | 9 | 10 |
| Suction Pressure (psig) | 58 | 67 | 77 |
| HP Utilization (%) | 77% | 91% | 99% |
Running two more simulations as seen in the above chart proves that we can operate in our desired minimum to maximum range. The next step is to determine the full operating range for our compressor with the creation of a start-up package.
Detechtion produces start-up packages for our clients which is a document that details the configuration, control points, and shutdown set points required for the compressor to run optimally. The start-up package considers the full range of pressures that the compressor could operate in and limits the conditions so that it will not exceed any potentially catastrophic conditions. For example; Rod Loads, net rod loads, reversals, and low volumetric efficiencies, are factors not visibly evident but could have catastrophic results if not considered.
The process for creating a start-up package may differ depending on your equipment, maintenance practices and/or operating philosophies. The process that Detechtion typically follows is detailed as follows and is based on 4 operating points:
| Limiting Factors/Objectives | High Shutdowns | High Suction Control |
|---|---|---|
| Keep Driver Utilization | <105% | <99% |
| Keep Rod Loads | <95% | <90% |
| Keep Reversals | <65% | <70% |
| Corresponding Load Step | 1 | 2 |
| Limiting Factors/Objectives | Low Suction Bypass | High Suction Control |
|---|---|---|
| Keep Discharge Temperatures | < Max Allowable | < Max Allowable |
| Keep Volumetric Efficiencies | >20% | >16% |
| Keep HP Utilization | >30% | >25% |
| Keep Rod Loads | <90% | <95% |
| Corresponding Load Step | 4 | 6 |
Using these 4 operating points as our limiting factors, the following start-up package was created and represents the full operating range along with the control points and shutdowns for our chosen configuration. This documentation and knowledge can now be handed off to the personnel responsible for completing the MOC review and making the adjustments:
Although the objective only required the asset to move between 8-10mmscfd at a 700-1100 psig discharge pressure, the above start-up package indicates that if needed, the compressor can handle flow between 5-10 mmscfd, between a range of 35-77 psig suction pressure while protecting the units if these wider ranges are exceeded. The wider operating band will keep the unit out of recycle ultimately improving the unit’s overall efficiency.
- Track Results
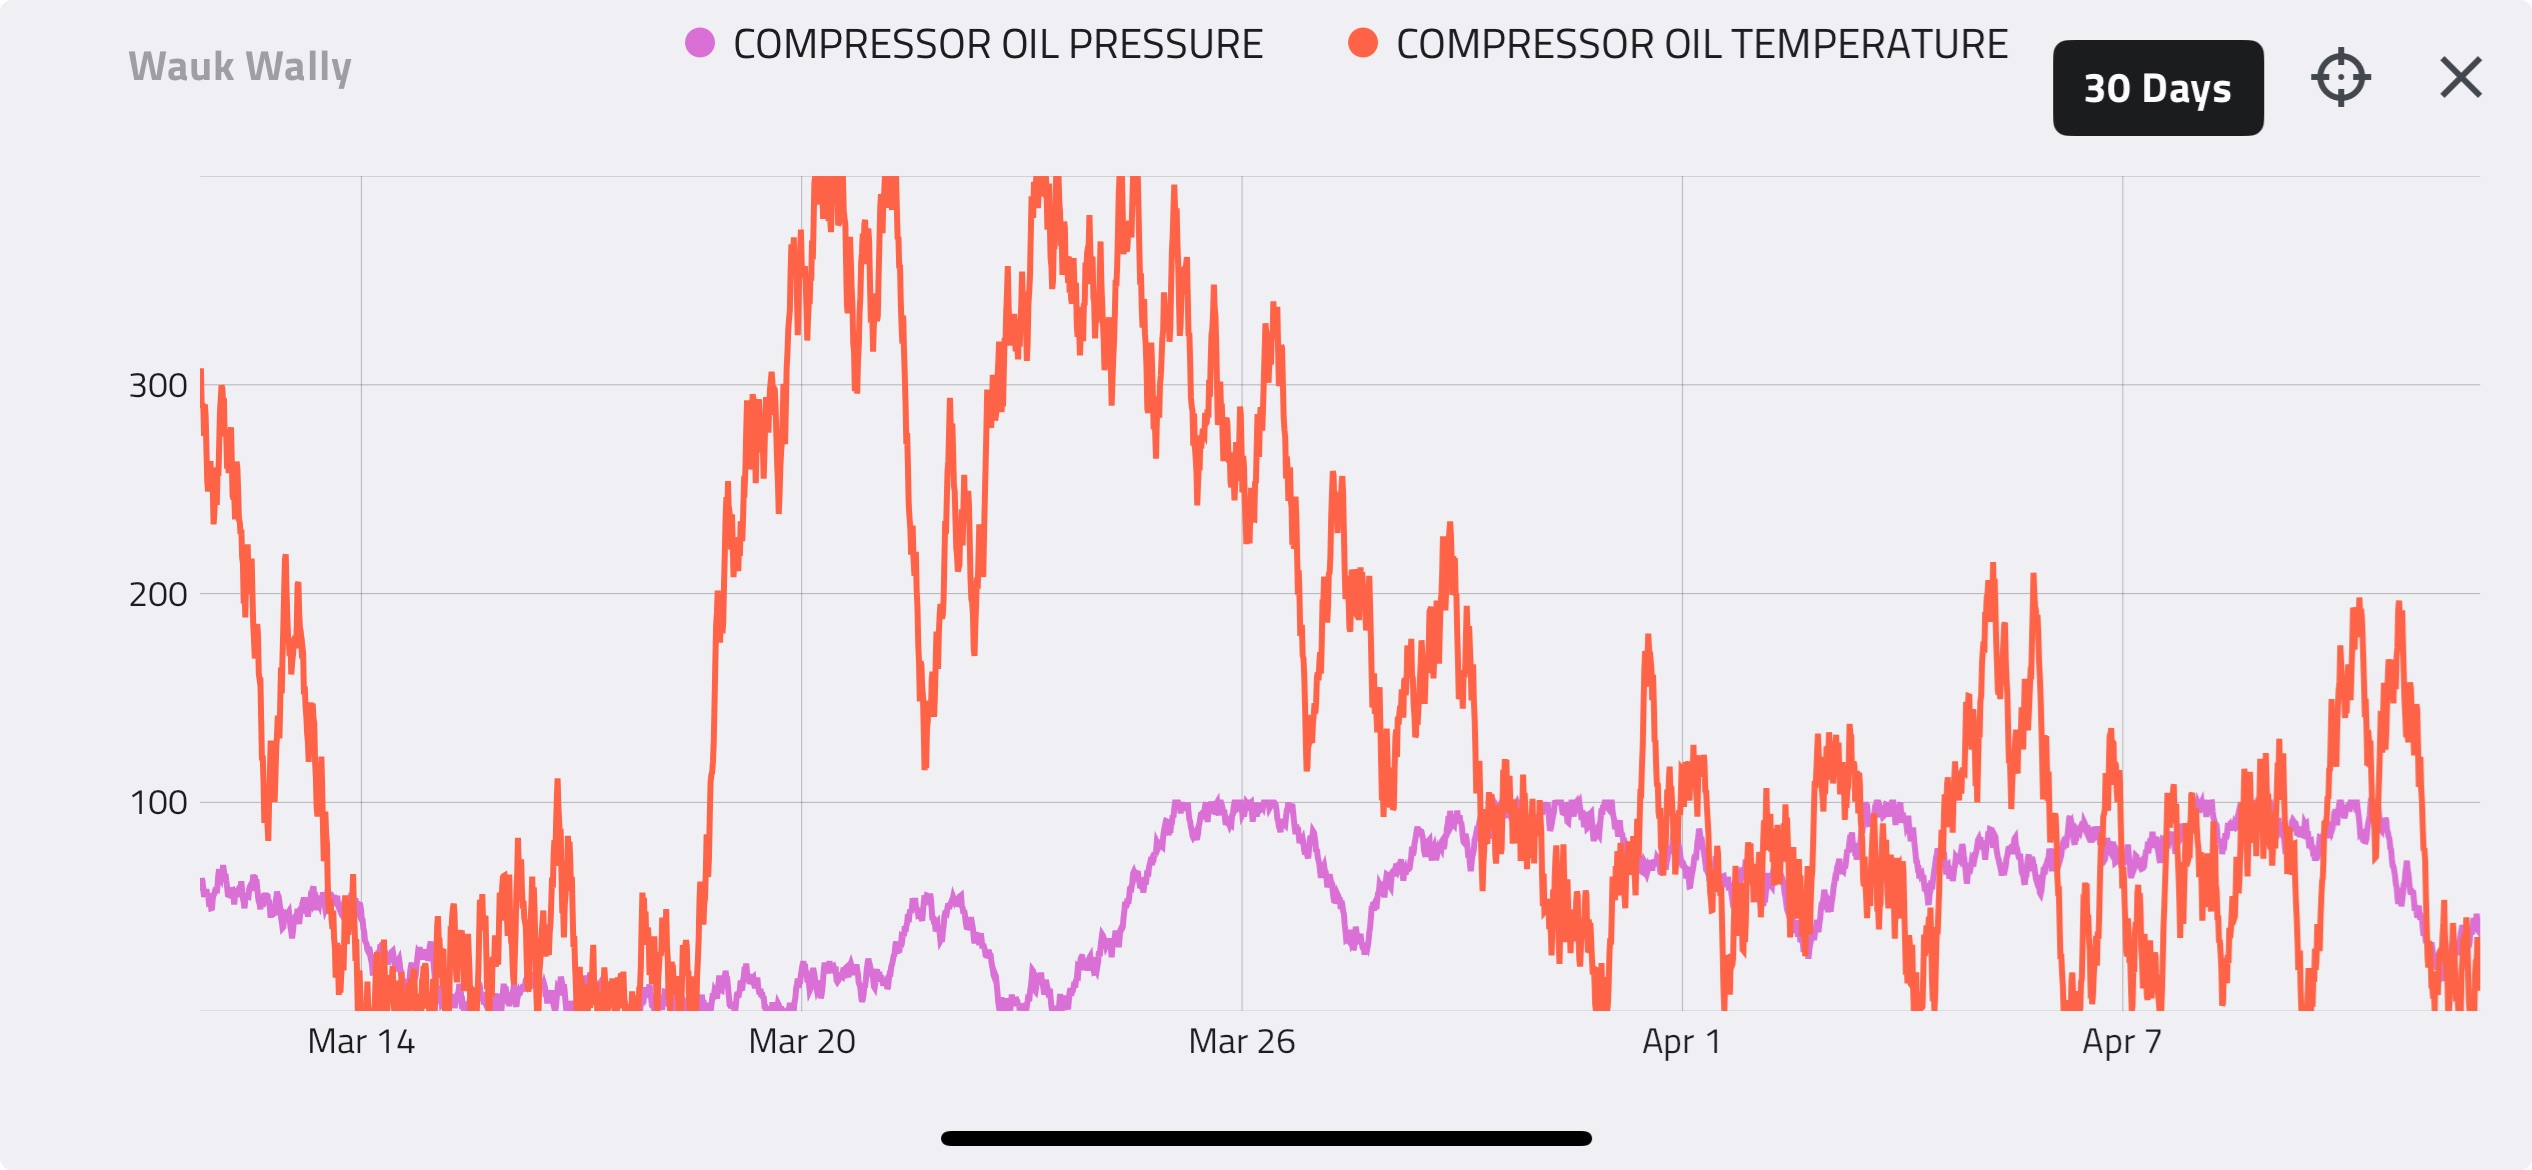
After the changes have been made and the compressor is optimized, it is important to ensure that the results were as expected. Detechtion has numerous approaches to assessing the benefits of a configuration change which involves assessing changing trends, verbal feedback, or looking over a time period. Assuming the data is available, comparing the 30 days before and after the optimization provides an excellent resource for assessing the overall outcome of the change and whether or not the opportunity was acted on effectively or if further opportunities exist for optimization.
| Key Performance Indicator | 30 Day Before | 30 Day After | Change | Comment |
|---|---|---|---|---|
| Average Production (mmscf) | 9 | 9.2 | 0.2 | $12,000/month Production Gain (@2.00/mscf) |
| Average Suction Pressure (psig) | 70 | 66 | -4 | |
| Average Discharge Pressure (psig) | 1000 | 1000 | 0 | |
| Average HP Utilization (%) | 85 | 92 | 7 | $1,020/month increase to fuel cost (@2.00/mscf) |
| Average Fuel Usage (mscf) | 212 | 229 | 17 | |
| Downtime (hrs) | 18 | 6 | -12 | $xx,xxx/month saved in personnel callouts |
If you are happy with the results, it is time to give those involved a pat on the back for creating positive results, continue monitoring the asset, and look for the next opportunity!