The Oil and gas industry is continuing to operate more safely, and with higher profitability as a result of evolving business processes and technology. Among a number of factors, data analysis and data analytics are central to improving a company's overall efficiency. What exactly does this mean though? And how do Detechtion products help companies improve their ability to perform useful data analysis and data analytics?
Data analysis and data analytics are often treated as interchangeable terms, but they hold slightly different meanings.
Data analysis is used to explain things that happened in the past. In the context of natural gas compressor monitoring and optimization, data analysis might be able to provide you context on your best and worst performing assets'. For example, by utilizing the Enbase® availability report, you might find out that the most prevalent reason for poor runtime is the result of fluctuating inlet pressures and discharge pressures exceeding the assets shutdown set points.
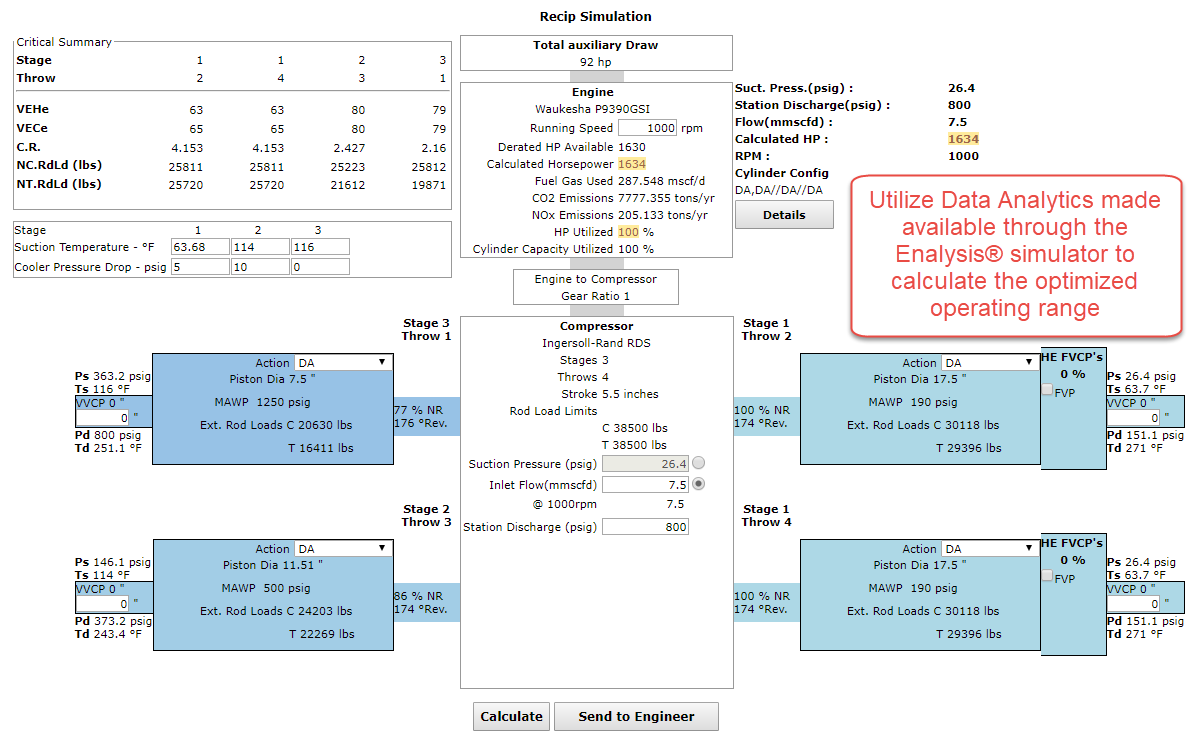
Data Analytics is the application of logical and computational reasoning to the data obtained in the analysis, and in doing this, you are looking for patterns in exploring what you can do with them in the future. Here, analytics branches off into two areas, qualitative analytics and quantitative analytics. Qualitative analytics, in this example, is understanding that the solution to shutdowns caused by fluctuating inlet and discharge pressures might be to install suction control and bypass control valves, or revisiting the shutdown set points. Quantitative Analytics would then be utilizing the Enalysis® simulator to calculate the optimized operating range and determine the optimized range of suction control valve, bypass control, and shutdown set points. By leveraging your data, it might be possible to increase a single asset's runtime significantly.
It is important to recognize that when used together and correctly, data analysis and data analytics will help you achieve the most value out of your data. If you could for example, improve the runtime of your equipment from 87% to 95%, or 98% to 99% by performing this type of analysis, what would that mean for your business? And what other applications can data analysis and analytics be used to improve your and your company's overall efficiency?
The following figure highlights how you can leverage to the Enbase® availability report to identify the most prevalent reasons for downtime across your fleet: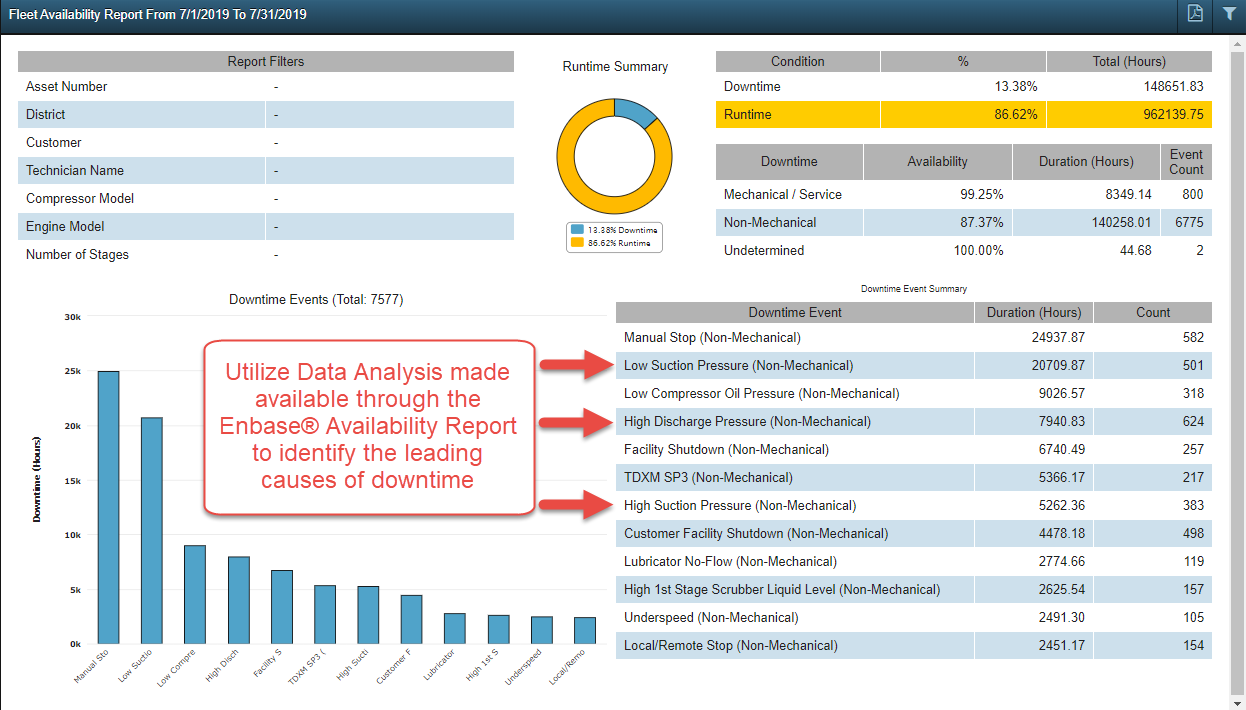
The following figure highlights how you can leverage to the Enalysis® simulator to determine the optimized range for your compressor to reduce unplanned shutdowns: